Epileptic seizure prediction
Epilepsy causes recurrent aberrant hypersynchronous electrical discharges in the brain (Chaovalitwongse et al 2006). Resulting of abnormal complex dynamical interactions between different cerebral regions, epileptic seizures are often characterized by the intermittent occurrence of synchronous paroxysmal activities. Although the pathophysiological processes underlying epileptic neural activities are known, the mechanisms involved in the generation and propagation of epileptic seizures are still unknown. Seizures often start suddenly in an unpredictable way. This is why epileptic patients are often at high risk of severe injury or death. However, some patients feel a premonitory phase minutes to hours prior to seizures (Rajna et al 1997). This feeling is different from an aura, which is characterized by distinct visual, motor, sensory, or psychological perceptions felt within a few seconds to one hour prior to seizures (Alvarez-Silva et al 2006). The identification of early changes in preictal periods may provide valuable insight into such mechanisms. Moreover, reliable seizure prediction methods can considerably improve the quality of life of epileptic patients. Using data-driven and model-based approaches, we investigated changes in the brain dynamics in preictal periods in patients with generalized and partial seizures.
Data-driven approach
Generalized seizures
Theoretically, a "preictal state" can be defined as a period, within which the epileptic brain activity inevitably evolves into a seizure if no kind of interruption occurs (Lehnertz et al 2001). Generalized seizures like absence seizures are associated with spike-and-wave discharges (SWd, Fig.1) (Gloor and Fariello, 1988; Loiseau, 1992; Mirsky et al., 1986; Passouant, 1991). It is generally believed that SWds are generalized, with a sudden onset. However, findings using intracerebral recordings have shown ictal discharges starting locally and spreading rapidly in premotor or premotor/prefrontal or prefrontal/premotor/precentral/parietal areas (for a review see Hirsch et al., 2006). Several investigations have also demonstrated that extensive corticothalamic networks are driven by a cortical center during spontaneous absence seizures in rats (Meeren et al., 2002, 2005).
In our first study, we explored the linear and nonlinear spatio-temporal synchronization profile of EEG signals before, during, and after 35 absence seizures in EEG recordings from six patients to determine whether the change from interictal to ictal activities in absence seizures is an abrupt phenomenon (Aarabi et al., 2008).
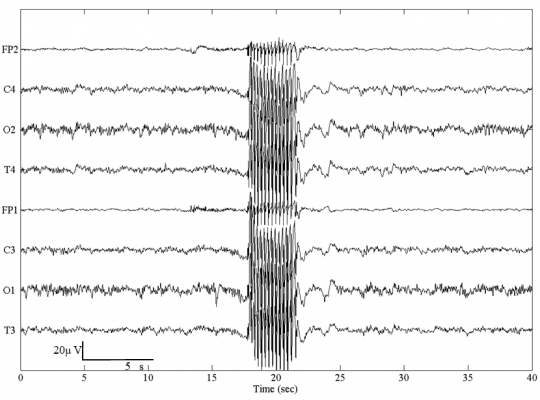
Figure 1. A typical absence seizure with 3-Hz generalized spike-and-wave discharges.
After bandpass filtering, EEG data were segmented and analyzed using a 5-sec moving window with an overlap of 90% between consecutive windows. The interchannel synchronization was then computed between different channels using four linear and nonlinear bivariate measures (cross-correlation, mutual information, phase synchronization and nonlinear interdependence).
For the seizure illustrated in Fig. 2, the synchronization profiles between channel T4 and other channels is shown for each synchronization measure. As shown, a decrease in the ipsilateral synchronization is observed just before the onset of the seizure. During the seizure, the synchronization first increases and then decreases progressively in the postictal state.
For each patient, we then compared the synchronization profile of the EEG signals prior to seizures with that of a reference period (300 sec) selected far from (at least 50 sec) any seizures during the interictal activity. For each seizure, we further performed the same comparison with an interictal period (far from the seizure) selected within the interictal activity preceding the seizure. We used the Wilcoxon test to assess the significance of the synchronization differences between the preictal periods and the reference periods.
Based on the synchronization level for the preictal state with respect to the single reference window (far from any seizures) selected within interictal activity for each patient, we classified the seizures into three classes (Fig. 3a):
Class 1: containing 48% of the seizures, the preictal state was characterized by a desynchronization (a decrease in synchronization level).
Class 2: containing 46% of the seizures, the preictal state was characterized by hypersynchronization (an increase in synchronization level).
Class 3: containing 6% of the seizures, no difference in synchronization level was observed between the preictal and reference periods.
Based on the synchronization level for the preictal periods with respect to the reference period (far from the seizure) selected within interictal activity preceding each seizure, we found that 63% of all the seizures belonged to class 1, 31% to class 2 and the remaining 6% to class 3 (Fig. 3b).
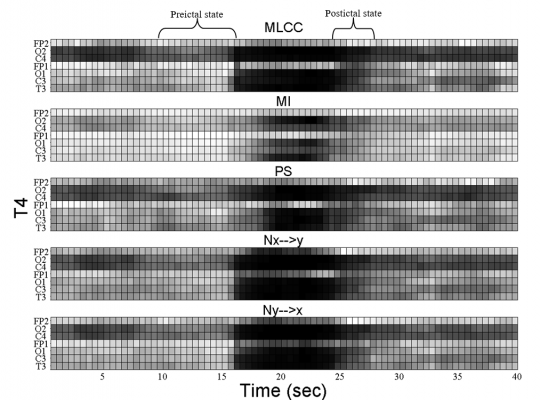
Figure 2. Interchannel synchronization obtained by maximum linear cross correlation (MLCC), mutual information (MI), phase synchronization (PS), nonlinear interdependence (Nx->y and Ny->x) calculated for channel T4.
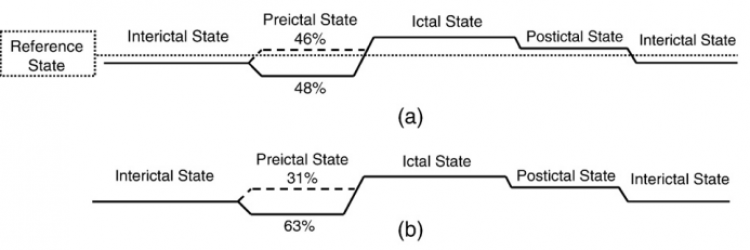
Figure 3. Evolution of synchronization during the interictal, preictal, ictal, and postictal states with respect to (a) the single reference window selected far from any seizures within interictal activity for each patient, (b) the interictal period selected far from each seizure within interictal activity preceding the seizure. For class 1 and 2, the percentage of seizures (across all patients) has been indicated in each plot.
Partial seizures
In partial epilepsy, several linear and nonlinear analysis techniques have been used to identify preictal periods by investigating various properties of EEG signal, with varying degrees of success (see Litt and Echauz 2002, Iasemidis 2003, Mormann et al 2006, 2007 for an overview). A number of studies have employed univariate measures taken from the nonlinear dynamics and chaos such as correlation dimension (Lehnertz and Elger 1995, Lehnertz et al 2001), correlation density (Martinerie et al 1998), largest Lyapunov exponent (Iasemidis et al 1990), dynamic similarity index (Le Van Quyen et al 2001), entropy (Van Drongelen et al 2003) and predictability (Drury et al 2003). EEG analysis using univariate nonlinear measures has provided evidence that transitions between interictal and ictal states may happen within minutes to hours prior to seizures, with characteristic changes evolving from high (possibly chaotic) to low complexity dynamics (rhythmic behavior during a seizure) (Basar 1998). Based on the hypothesis that interactions between neuronal networks involved in the epileptogenic process may also change prior to seizures' onset, many researchers have employed bivariate measures such as nonlinear interdependence (Arnhold et al 1999), phase synchronization, and cross-correlation (Mormann et al 2000, 2003) to predict seizures. For preictal characterization, univariate and bivariate nonlinear tools provide complementary information representing different dynamic characteristics of the EEG (Lehnertz et al 2001). Therefore, extracting multiple univariate and bivariate features from EEG might potentially improve the performance of seizure prediction tools to the level acceptable for clinical use (Iasemidis and Sackellares 1996). The use of combined univariate and bivariate analysis is also beneficial for efficiently characterizing preictal dynamics of neuronal networks involved in the epileptogenic process.
In a study published in 2012 (Aarabi and He, 2012), we developed a patient-specific rule-based seizure prediction system using combined univariate and bivariate nonlinear measures (Fig. 4). The main goal was to better characterize preictal periods and to improve seizure prediction performance. For this purpose, five univariate measures including correlation dimension, correlation entropy, noise level, Lempel-Ziv complexity, and largest Lyapunov exponent as well as one bivariate measure, nonlinear interdependence, were extracted from non-overlapping ten-second segments of intracranial EEG (iEEG) data recorded using electrodes implanted deep in the brain and/or placed on the cortical surface. The spatiotemporal information was then integrated by using rules established based on patient-specific changes observed in the period prior to a sample seizure selected from each patient. The system was tested on iEEG data containing 87 seizures recorded from 21 patients with medically intractable focal neocortical and hippocampal epilepsy (Aarabi and He, 2012 and 2017).
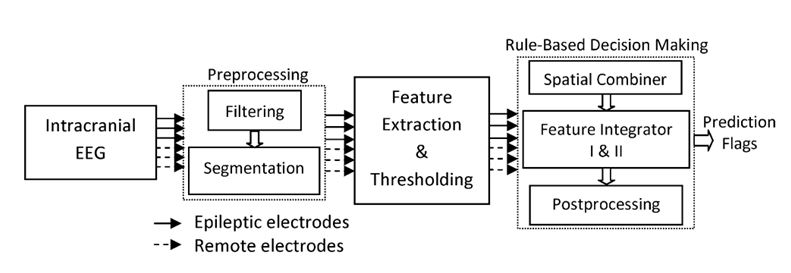
Figure 4. Schematic diagram of the seizure prediction system.
We evaluated the system's performance using commonly used parameters including sensitivity, specificity and false prediction rate. On seizures with neocortical origin (Aarabi and He, 2012), our rule-based seizure prediction system achieved an average sensitivity of 79.9% and 90.2% and an average false prediction rate of 0.17 and 0.11/h using seizure occurrence periods (SOP) of 30 and 50 min, respectively. Our system showed relatively better prediction performances (average sensitivity of 86.7% and 92.9% and false prediction rate of 0.126 and 0.096/h with SOPs of 30 and 50 min, respectively) for patients with focal hippocampal epilepsy (Aarabi and He, 2017). Our approach outperformed the random and periodical prediction methods (Fig. 5). We also found that changes in the dynamics of epileptic networks were not necessarily restricted to the electrodes located in the epileptogenic zone. Moreover, the spatiotemporal pattern of preictal changes can be captured using univariate and bivariate measures in a patient-specific manner.
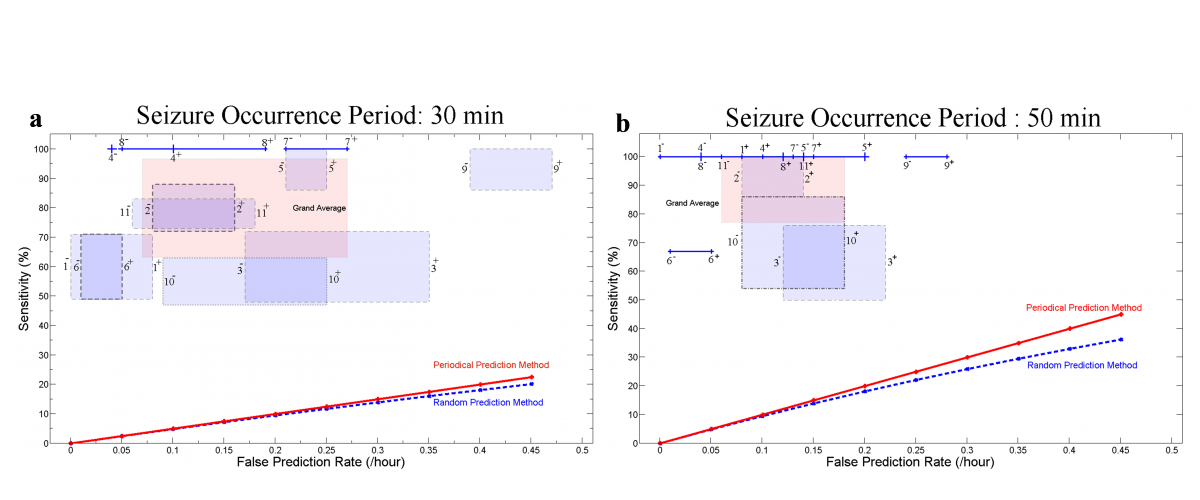
Figure 5. Sensitivity versus false prediction rate for each patient and for the grand average across patients (labeled in pink as Grand Average) for the seizure occurrence period of (a) 30 and (b) 50 min and SPH = 10 s. For each patient, the box or line shows the range of variation of sensitivity versus false prediction rate when different randomly selected reference windows are used. Plus and minus signs used with the patients’ number denote the upper and lower bounds of the corresponding ranges of variation. The performances of the random and periodical prediction methods show values much lower than those found using our system. Seizure occurrence period (SOP): After a prediction alarm, the time period within which a seizure is expected. Seizure prediction horizon (SPH): A time window between any prediction alarm and the beginning of SOP.
Model-based approach
Due to the complexity of seizure-precipitating factors, current seizure prediction methods may still be too rudimentary to extract all relevant parameters reflecting dynamical changes in the EEG signals preceding epileptic seizures (Mormann et al., 2007). The seizure prediction problem thus becomes exceedingly difficult when multiple regions of the brain are involved in the preictal period. Even if there is a well-defined spatio-temporal preictal state as revealed by linear and nonlinear analyses of the EEG (Mormann et al., 2006), there still remains no established physiological correlation between preictal changes and the underlying neurophysiological process taking place within the preictal state (Lopes da Silva et al., 2003a,b). In general, the dynamics of the preictal transition appear to be complex, as observed even in some patients exhibiting preictal periods of different durations. Therefore, a different approach incorporating physiological parameters is desirable to improve the performance of seizure prediction. Such an approach may also be useful in characterizing false predictions that exhibit dynamics similar to that of true predictions.
In the study published in 2014, we developed a model-based method to predict seizures in patients with hippocampal and/or neocortical seizures (Fig. 6). We used a neural mass model (Fig. 7) incorporating biophysical parameters such as connectivity strengths (coupling between excitatory and inhibitory subpopulations) to investigate whether the periods preceding neocortical and hippocampal seizures could be characterized by changes in the parameters of the model in comparison with interictal periods far from seizures. Towards this objective, the model was fit to the spectra of iEEG data. A patient-specific rule-based system was then designed to spatiotemporally integrate preictal changes in order to capture the essence of the transition from the interictal state to ictal activity. Finally, we assessed the system's performance at single-subject and group levels.
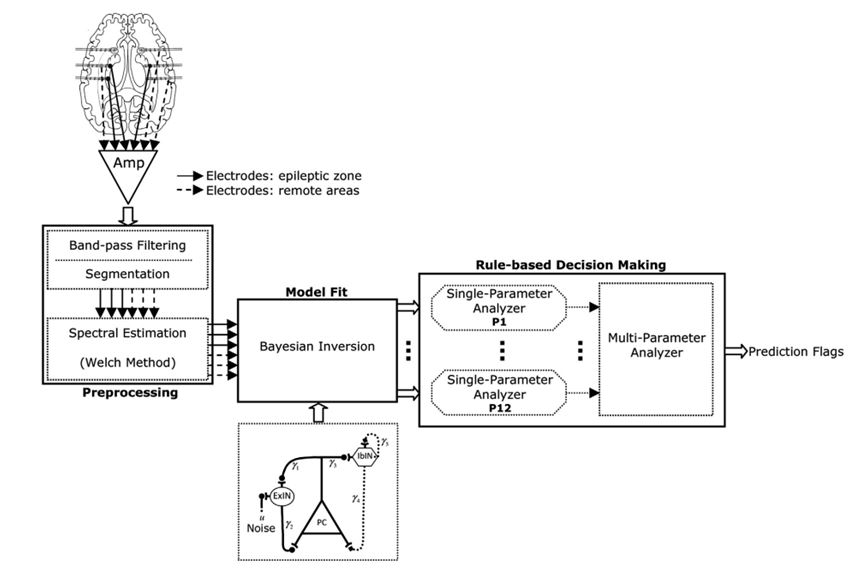
Figure 6. Schematic diagram of the model-based seizure prediction system.
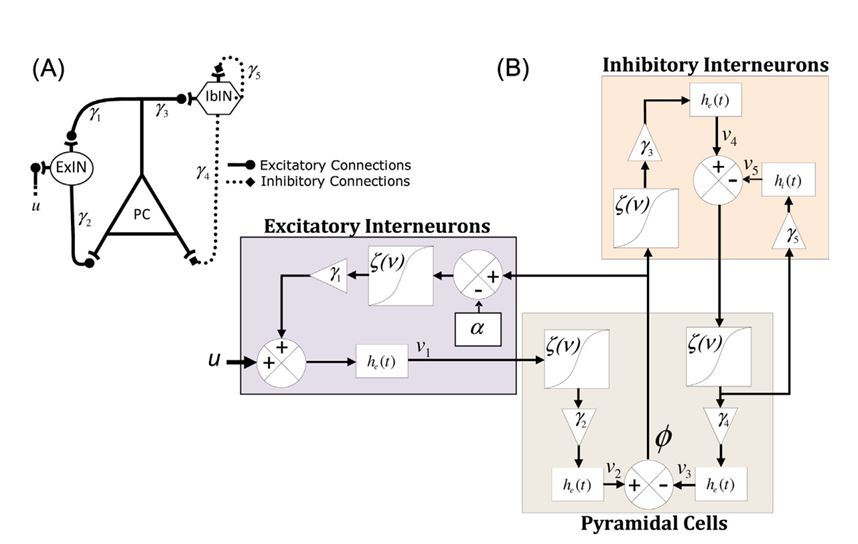
Figure 7. Canonical neural mass model (A), and schematic diagram of the neural mass model (B). ExIN, excitarory interneurons; IbIN, inhibitory interneurons; PC, pyramidal cells.
Twenty-one patients with medically intractable hippocampal and neocortical focal epilepsy were included in the study. In total, we analyzed 596 hours of iEEG data, containing 87 seizures. Using the maximum sensitivity strategy, our rule-based seizure prediction system achieved an average sensitivity of 87.07% and 92.6% with an average false prediction rate of 0.2 and 0.15/h, and an average specificity of 95.8% for seizure occurrence periods of 30 and 50 min, respectively. Similarly, using the maximum specificity strategy, the system's sensitivity decreased to 82.9% and 90.05% for seizure occurrence periods of 30 and 50 min, respectively. However, the false prediction rate decreased to 0.16 and 0.12/h, respectively (Fig. 8). Our model-based seizure prediction method was able to capture preictal changes at least 15 min before seizures' onset. The transitional preictal states differed from seizure-free interictal control periods on intracranial electrodes located within the epileptic zone, as well as on those located in remote areas. The differences in the model parameters between periods preceding the seizures and baselines were statistically significant. The system also largely outperformed the random and periodic prediction methods. The spatio-temporal changes in the parameters demonstrated patient-specific preictal signatures that could be used for seizure prediction (Aarabi and He, 2014).
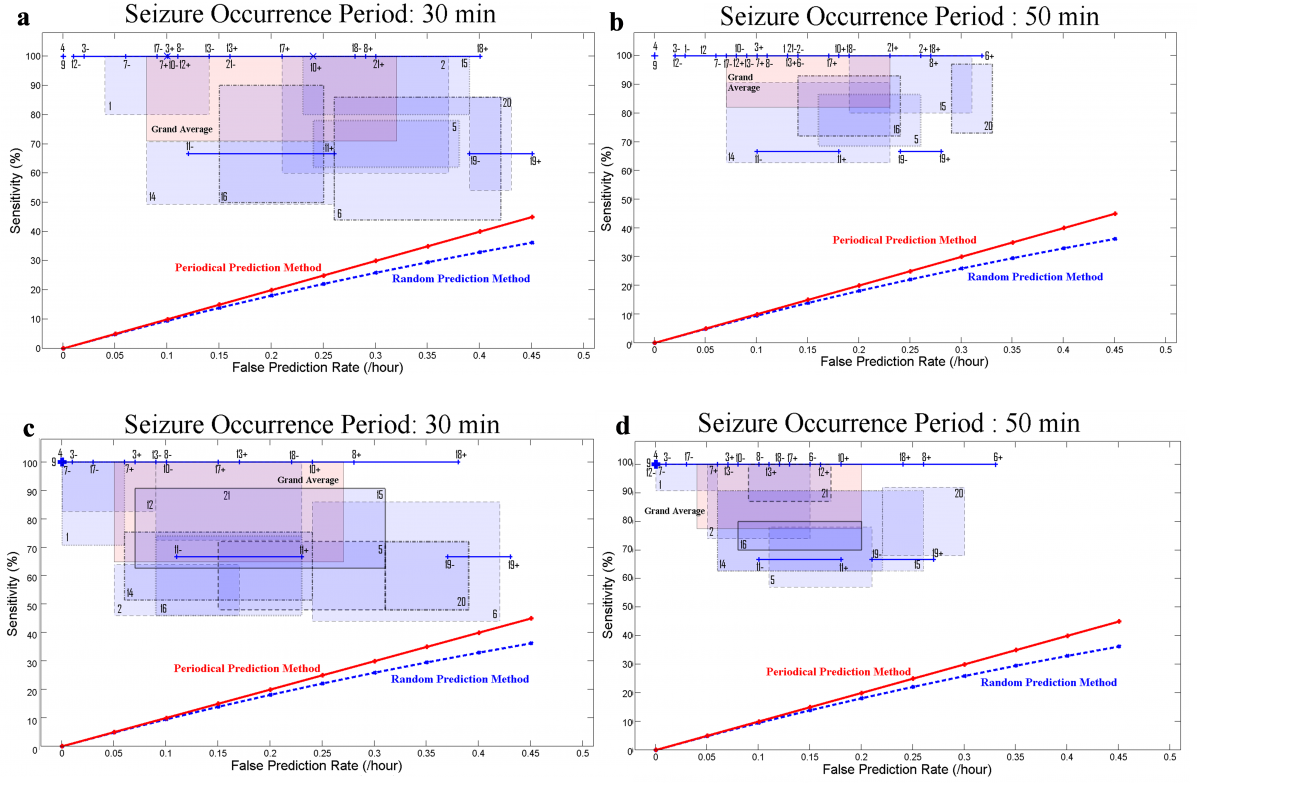
Figure 8. Sensitivity versus false prediction rate for each patient (1-21) and for the grand average across patients (labeled in pink as grand average) using seizure occurrence periods of 30 min (a and c), and 50 min (b and d) and a seizure prediction horizon of 10 s. Results for the maximum sensitivity and maximum specificity strategies are shown in (a–b) and (c–d), respectively. For each patient, a box shows the range of variation of sensitivity versus false prediction rate obtained using different randomly selected reference windows. It is of note that a line (e.g. for patient 11) or a dot (e.g. for patient 4) represents the results, where no variations in sensitivities or/and in false prediction rates were observed. Plus and minus signs used with the patients’ number denote the upper and lower bounds of the corresponding ranges of variation.
Further analysis will be conducted to investigate interregional influences and their relation to mechanisms underlying the transition from interictal to ictal states using coupled neural mass models. As the second step to improve the performance of our seizure prediction tool, the Bayesian inversion method, which includes the second-order moment of the posterior density on the model’s parameter (Daunizeau et al., 2011) will be used to minimize dependencies between the estimates of the model parameters.