Cortical source imaging of resting-state EEG in ADHD children
Attention deficit hyperactivity disorder (ADHD) is characterized by inattention, hyperactivity and impulsivity, with a prevalence rate of 3–7% reported for school-aged children (Burd et al., 2003; Polanczyk and Jensen, 2008). Electroencephalography (EEG) has been extensively used to investigate neural abnormalities in ADHD (Lenartowicz et al., 2018). Resting-state EEG can provide valuable information concerning alterations in the temporal dynamics of brain functions in the absence of any tasks requiring high cognitive demands especially in children. The majority of EEG studies performed on ADHD patients has focused on changes in spectral characteristics of scalp EEG in different physiological frequency ranges including delta, theta, alpha and beta bands (Newson and Thiagarajan, 2018). When compared to typically developing controls, children with ADHD have been characterized with higher and lower power in low (delta and theta) and high frequency (alpha and beta) bands, respectively (Lubar, 1991). More specifically relative to healthy controls, the ADHD population has shown elevated theta/beta (TBR) and theta/alpha power ratios, interpreted as an index of immature brain activity (Barry et al. 2003; Snyder and Hall, 2006; Giertuga et al., 2017). Overall, the interpretation of changes in EEG spectra at sensor level may be less reliable due to the volume conduction effect caused by the electrical conduction properties of the head (Hassan and Wendling, 2018). To address this issue, EEG source imaging methods including the low resolution brain electromagnetic source tomography (LORETA; Pascual-Marqui, 2002) have been used in many studies to analyze source activity of resting state EEG signals in the frequency domain (Babiloni et al., 2011; Imperatori et al., 2014; Adebimpe et al., 2015).
In this study, we investigated differences in spectra and current source densities of eyes-closed resting state EEG between children with combined and inattentive subtypes of ADHD and healthy controls in different frequency bands. We also explored age-dependent changes in resting-state EEG activity in ADHD and typically developing children using the main processing pipeline illustrated in Fig. 1. We first performed spectral and cortical source (exact low-resolution electromagnetic tomography, eLORETA) analyses using high-density eyes-closed resting state EEG recordings from 40 children (8-16 years) with combined and inattentive subtypes of ADHD and 41 age-matched healthy controls (HC). To test the effect of age and ADHD subtype on EEG spectra and current source densities, we grouped the patients and healthy subjects into six subgroups, four age-subgroups (8-10, 10-12, 12-14 and 14-16 years) and two subtype subgroups (inattentive and combined). Statistical comparisons were then performed between ADHD and HC subgroups to assess group-level differences in EEG spectra and current source densities in each frequency band.
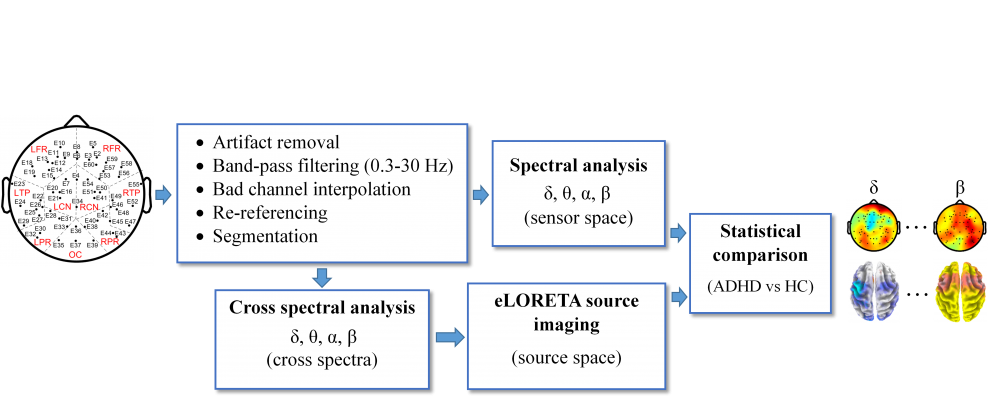
Figure 1. EEG spectral and cortical source analysis pipeline.
Compared to the typically developing children, ADHDC was characterized with a significant diffuse increase in TBR with a widespread decrease in beta current source densities (CSDs, Fig. 2). The ADHDC subgroup also exhibited a significant increase in theta source power in the central, parietal and occipital regions. The ADHDI subgroup, however, presented increased TBR values in the frontal, central and temporal regions with a global increase in theta current source densities. In this subtype relative to HC, the beta fronto-central sources displayed significantly decreased current densities.
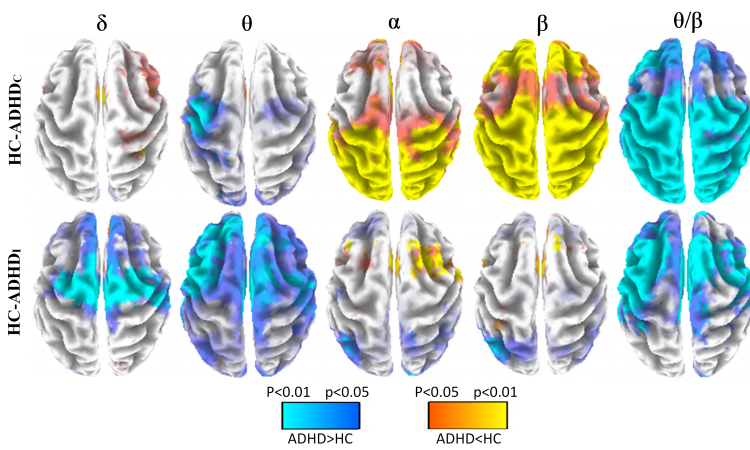
Figure 2. Statistical p-maps (axial view) displaying significant differences in nCSD (eLORETA solutions) between HC and ADHD subtypes (ADHDC and ADHDI) within the delta (δ), theta (θ), alpha (α) and beta (β) bands. The rightmost column shows the p-maps for the theta/beta power ratio (θ/β) for each subgroup. The colorbar shows statistical differences based on p-values with p<0.05 corrected for multiple comparison with non-parametric randomization (5000 randomizations) across all frequency bands and voxels. The color scale represents log F-ratio values with a threshold (for p<0.05) of ±0.16 and ±0.29 for ADHDC and ADHDI, respectively. The blue (red) color indicates greater (weaker) nCSD for ADHD compared to HC. HC: Healthy controls; ADHD: Attention deficit and hyperactivity disorder; ADHDC: ADHD combined; ADHDI: ADHD inattentive; nCSD: normalized current source density.
Compared to HC, higher current densities were observed for theta sources in the bilateral central and parietal regions for ADHD10-12, in the frontal regions for ADHD12-14 and in most brain regions (less pronounced in posterior areas) for ADHD14-16 (Fig. 3). In ADHD relative to HC, delta sources showed significant decreases in nCSD in children aged 12-16 years. A diffuse decrease in beta source power was observed in ADHD children aged 8-14 years. Interestingly, beta source power in all brain regions showed no significant differences between ADHD14-16 and the controls. In the alpha band, however, a decrease in source power in ADHD relative to HC was observed in fronto-central (ADHD8-10) and posterior areas (ADHD10-12) or in both areas (ADHD14-16). A widespread pattern of increased TBR was found for ADHD10-12, ADHD12-14 and ADHD14-16 relative to HC, with a declining pattern over age.
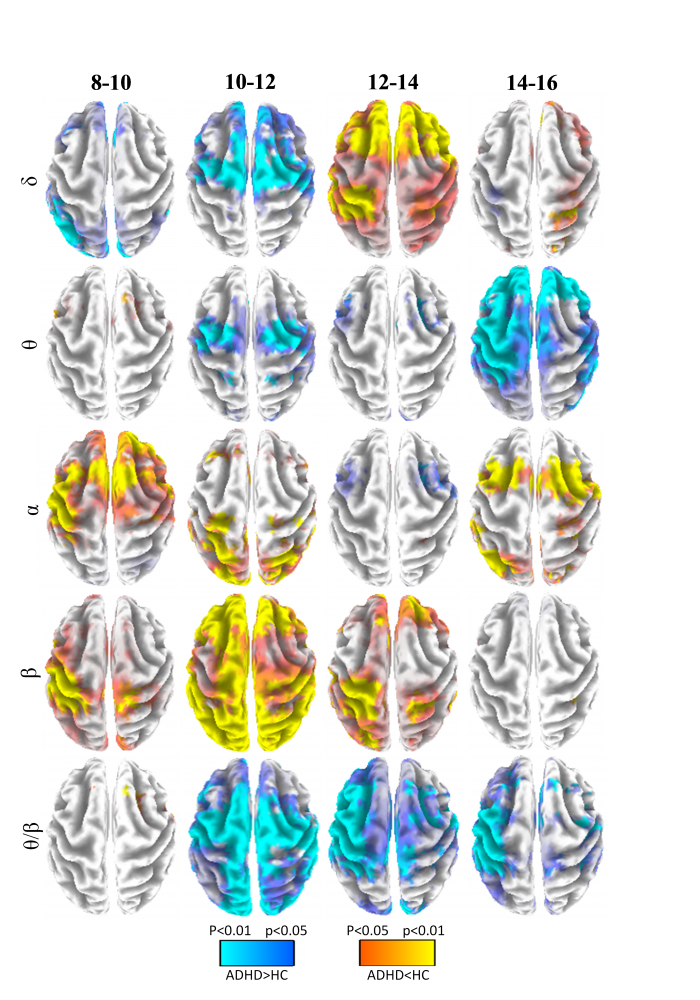
Figure 3. Statistical p-maps (axial view) displaying significant differences in nCSD (eLORETA solutions) between HC and ADHD age subgroups (8-10, 10-12, 12-14 and 14-16 years) in the delta (δ), theta (θ), alpha (α) and beta (β) bands. The bottom row shows the p-maps of differences in the theta/beta power ratio (θ/β) for each subgroup. The colorbar shows statistical differences based on p-values with p<0.05 corrected for multiple comparison using non-parametric statistical analyses (log F-ratio statistics with 5000 randomizations) across all frequency bands and voxels. The color scale represents log F-ratio values. The blue (red) color indicates greater (weaker) nCSD for ADHD compared to HC. HC: Healthy controls; ADHD: Attention deficit and hyperactivity disorder; nCSD: normalized current source density.
As shown, both HC and ADHD groups exhibited a diffuse decline in CSD of delta cortical sources with increasing age, with a more pronounced decline rate in ADHD (Fig. 4). While for older controls, theta source power declined significantly in the bilateral temporal and left central regions, for the ADHD group, densities of theta fronto-central and temporal sources showed significantly positive correlations with age. In both groups, alpha sources displayed significantly positive correlations with age in the bilateral frontal, central and temporal brain regions, with greater regression coefficients for ADHD children compared to healthy controls. An inverse trend was observed in both groups in posterior areas. In ADHD, beta CSD also showed a significant positive association with age in all regions except in posterior areas, demonstrating increased beta source power in older patients. In HC, the increase in beta source power with increasing age was only observed in the bilateral frontal regions. Finally, the TBR showed a widespread decreasing pattern with increasing age in ADHD. In HC, this pattern was observed in most brain regions except in prefrontal and posterior areas, however, with a greater decline rate compared to ADHD.
.
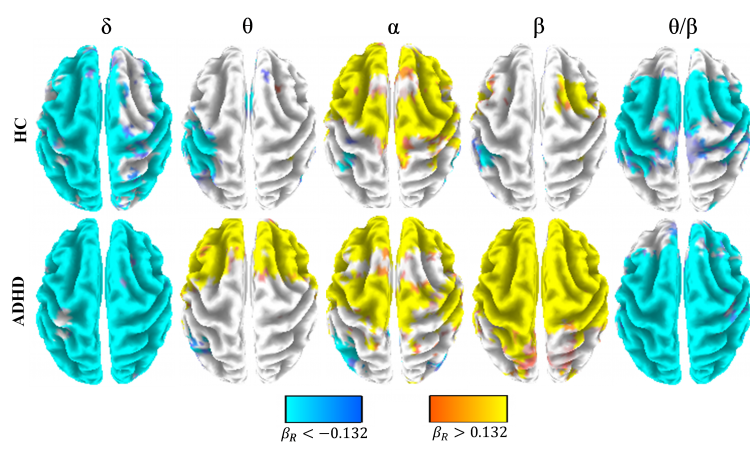
Figure 4. Group-level beta coefficient maps (axial view) showing regression coefficients between age and nCSD (eLORETA solutions) within the delta (δ), theta (θ), alpha (α) and beta (β) bands for HC and ADHD. The rightmost column shows the maps for the theta/beta power ratio (θ/β) for each group. The red (blue) color indicates voxels at which the correlation between age and nCSD was significantly positive (negative) with p<0.05 corrected with nonparametric randomization (5000 randomizations) across all frequency bands and voxels. HC: Healthy controls; ADHD: Attention deficit and hyperactivity disorder; nCSD: normalized current source density.
To obtain a more detailed view concerning the effect of age and ADHD subtype, we cross-validated the patterns of differences in EEG spectral power and cortical source densities between the ADHD and healthy children. Overall, both approaches resulted in concordant findings presenting similar trends of changes in resting EEG within different frequency bands. However, several discrepancies were observed between the results of the analyses performed at the sensor and source levels due to the fact that the recorded signals at different scalp locations are resulted from the volume conduction effect caused by a linear mixture of source activities from all brain regions (Loo and Makeig, 2012). Our results clearly emphasize the importance of the EEG source imaging analysis for studying abnormalities in resting state brain activities associated with ADHD.
Referencres
Ahmadi, M., Kazemi, K., Kuc, k., Cybulska-Klosowicz, A., Zakrzewska, M., Racicka-Pawlukiewicz, E., Helfroush, M.S., Aarabi, A., 2020. Cortical source analysis of resting state EEG data in children with attention deficit hyperactivity disorder, Clinical Neurophysiology, 131(9), 2115-2130.