Hemodynamic response to interictal spikes using a focal epilepsy model
Local blood flow and energy metabolism are considered to be intimately related to neuronal activation (Magistretti and Pellerin, 1999; Logothetis, 2002). External stimulations induce neuronal activation accompanied by vascular responses (changes in cerebral blood flow and blood oxygenation) in the brain (Buxton et al., 2004). Compared to neuronal activation, which is relatively short (a few milliseconds), the hemodynamic response elicited by stimulation is long, reaching a maximum between 4-6 seconds after onset of the stimulus, followed by an undershoot lasting 10 to 30 seconds (Buxton et al., 2004). The mechanism responsible for neurovascular coupling related to external stimulation has been extensively investigated in functional Magnetic Resonance Imaging (fMRI) and functional NIRS studies (Huneau et al., 2015 for a review). However, very few studies have investigated the neurovascular coupling mechanism related to endogenous neuronal activities such as interictal spikes.
We previously investigated hemodynamic changes assocaited with acute ElectroCorticoGraphic (ECoG) spikes using an animal model of epileptiform discharges generated by local cortical application of the GABA receptor antagonist bicuculline methiodide (Osharina et al., 2010). Our results suggested that hemodynamic changes associated with spikes started before the onset of the spikes and ended after the end of electrical signs of epileptiform activities (Osharina et al., 2010). We showed that pre-spike changes in hemodynamic signals preceded interictal ECoG spikes. We, therefore, postulated that pre-spike hemodynamic changes might modulate spike-evoked hemodynamic responses (Osharina et al., 2010). However, due to the overlap between hemodynamic responses of consecutive spikes, the averaging method could induce unpredictable changes in the response.
In this study, we chose two models of focal epilepsy that have been largely described in the literature as animal models to generate epileptiform activity (Matsumoto et al., 1964; Campbell and Holmes, 1984; Soukupova et al., 1993; Akdogan et al., 2008; Silfverhuth et al., 2011). Simultaneous ECoG and NIRS recordings were obtained in vivo from adult Sprague-Dawley rat brain during semi-periodic focal interictal spikes induced by local cortical application of low doses of Penicillin G (PG) and Bicuculline Methiodide (BM) as GABA deactivation agents. The Finite Impulse Response (FIR) deconvolution technique was then used to estimate the profile of hemodynamic changes in oxyhemoglobin (HbO), deoxyhemoglobin (HbR) and total hemoglobin (HbT) concentrations associated with interictal ECoG spikes in each rat using the method illustrated in Fig. 1.
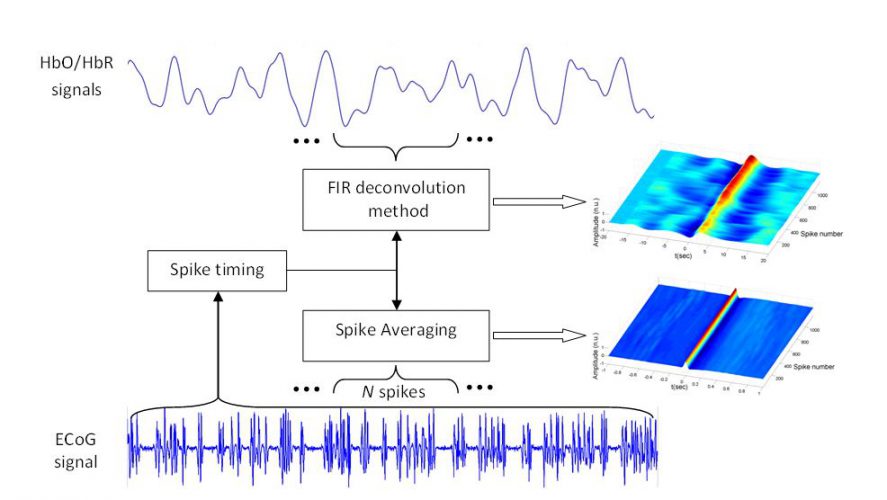
Figure 1. Dynamic approach used for spike averaging and hemodynamic response estimation using a moving window of N spikes. FIR: Finite Impulse Response, ECoG: ElectroCorticoGraphy, HbO: oxyhemoglobin, HbR: deoxyhemoglobin.
Fig. 2 shows the average profile of the HbO/HbR/HbT signals associated with spikes for both models. These average hemodynamic profiles were computed by grand averaging individual rat profiles estimated by the deconvolution technique for each model in each hemisphere. As shown, the hemodynamic pattern was identified and characterized by the changes observed with respect to the spike peak occurrence time (SPz). This figure also indicates the intervals with significant changes (p<0.001) in HbO, HbR and HbT with respect to the baseline. The pre-spike period, starting 2-3 s before SPz was characterized by significant bilateral decreases in HbO and HbT concomitant with a significant increase in HbR occurring after a slight delay with respect to the HbO/HbT changes. The post-spike periods consisted of the primary NIRS response and the undershoot/overshoot periods. The primary NIRS response period presented a significant increase in HbO amplitude accompanied by a significant decrease in HbR amplitude. This pattern corresponded to the expected changes described according to the classical view of the neurovascular coupling. The HbO/HbT increase and HbR decrease were followed by an undershoot period for HbO and an overshoot period for HbT from +5 to +10 s after SPz. A similar profile with significantly reduced amplitudes was observed on the contralateral side (Fig. 2).
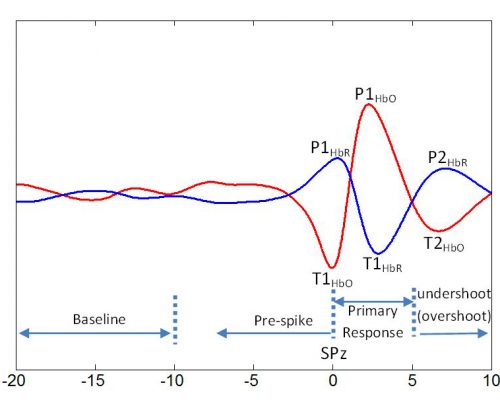
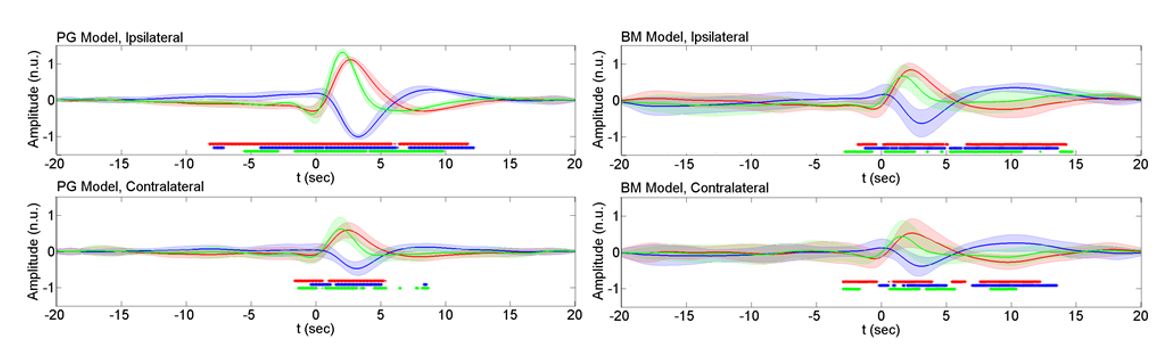
Figure 2. Averaged profile of HbO (red) and HbR (blue) for the BM model from our previous study (Osharina et al., 2010). The peaks (PHbO/HbR) and troughs (THbO/HbR) used for statistical comparisons between the BM and PG models are shown on the curves during the pre-spike and post-spike periods. Baseline was defined between -20 to -10 s prior to SPz (spike peak occurrence time). HbO: oxyhemoglobin, HbR: deoxyhemoglobin.
Fig. 3 shows the time-course of the ECoG spikes and their corresponding hemodynamic changes (HDC, for HbO and HbR) for rat 1 included in the BM model for the ipsilateral and contralateral sides with respect to the injection site. These results were computed by using the averaging method for ECoG spikes and the dynamic FIR technique, in which HDCs of spikes were estimated using a 200-spike long moving window. As shown, the spikes and their associated HbO/HbR changes were much stronger on the ipsilateral side. The spikes and HDC amplitudes gradually increased during the course of the spikes after the injection. The amplitude of the pre-spike and post-spike HDC components also increased significantly compared to baseline.
Similar analyses were performed for all rats included in the BM and PG models (Figs 4 and 5). Our results showed that: (i) the hemodynamic changes associated with the interictal spikes consist of the pre-spike period and post-spike neurovascular coupling followed by a return period to baseline, and (ii) the observed hemodynamic pattern is specific to the GABA-a deactivation model. The pre-spike hemodynamic changes observed especially prior to well-developed ECoG spikes were characterized with fast hemodynamic components above 0.08 Hz. The post-spike neurovascular coupling occurred in a classical manner where spiking activity evoked increases in oxygen concentrations by increasing blood flow followed by a return to baseline 5 to 10 s after spikes’ peak occurrence time.
Overall, the BM model exhibited several features. First, the amplitude and frequency of ECoG spikes progressively increased, reaching a maximum value around 20-25 min after application of the GABA receptor antagonist bicuculline methiodide and then gradually decreased. The HbO and HbR changes associated with the spikes also showed similar trends. The HbO and HbR curves showed a typical neurovascular coupling behavior, i.e., the amplitude of HbO increased at about 3-4 s and reached the minimum undershoot at about 8-10 s. The amplitude of the post-spike peak (P1HbO) also reached its maximum value around 20 min after the injection. After several minutes, the amplitudes of the pre-spike and post-spike HbO components (T1HbO and T2HbO) then reached their minimum values. An inverse trend was observed for HbR changes. Compared to the contralateral side, the ipsilateral hemodynamic changes were less variable in terms of shape, latency, and amplitudes, most likely due to the direct effect of the epileptic zone.
In the PG model, similar results were obtained with some major differences. The spike development course lasted longer in the PG model than in the BM model. In the PG model, the ipsilateral and contralateral ECoG spikes followed similar trends of changes in amplitude with weaker strength on the contralateral side. The PG model was also characterized with more stable HDCs in terms of latency and amplitude. Overall, the PG model showed higher stability in the shape, amplitude and latency of the HRF components.
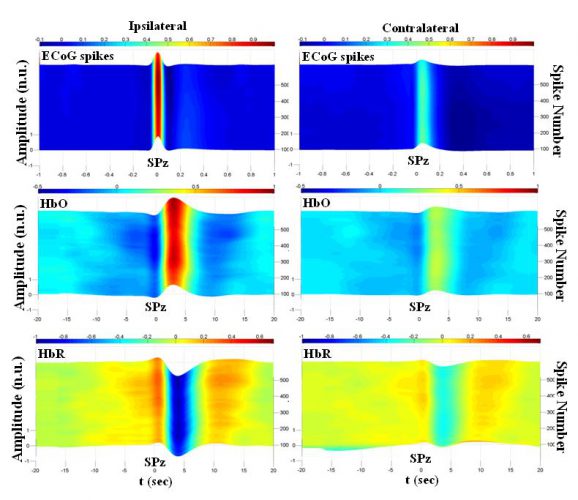
Figure 3. Time-course of ECoG spikes and their corresponding HbO and HbR on ipsilateral and contralateral sides for rat 1 included in the BM model. Spike amplitudes and their corresponding HbO and HbR changes have been normalized to their maximum values on the ipsilateral side. HbO: oxyhemoglobin, HbR: deoxyhemoglobin, SPz: spike peak occurrence time.
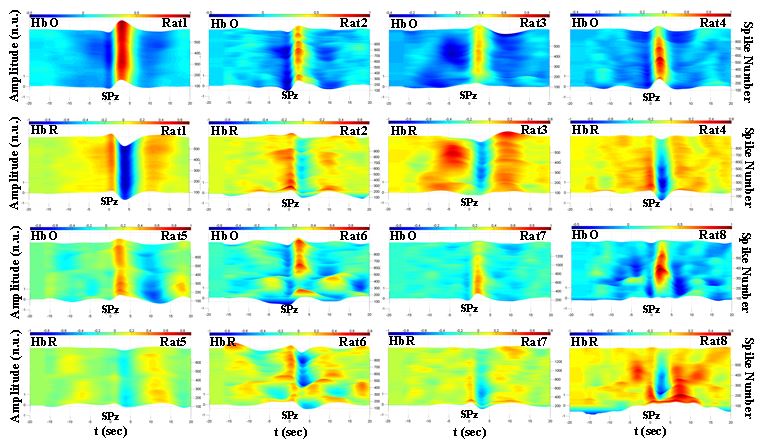
Figure 4. Time-course of HbO and HbR in the ipsilateral hemisphere for rats 1-8 included in the BM model. HbO and HbR amplitudes have been normalized to their maximum values for each rat. HbO: oxyhemoglobin, HbR: deoxyhemoglobin, SPz: spike peak occurrence time.
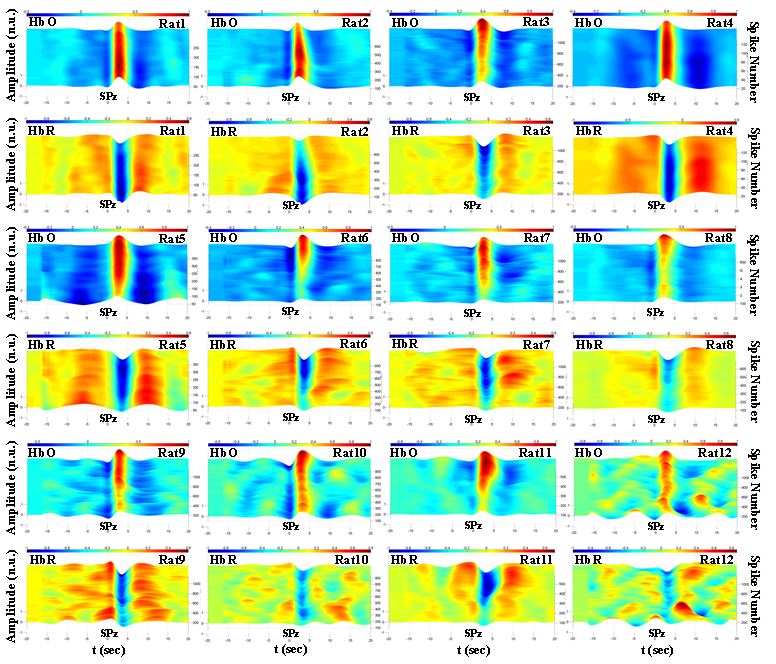
Figure 5. Time-course of HbO and HbR in the ipsilateral hemisphere for rats 1-12 in the PG model. HbO and HbR amplitudes have been normalized to their maximum values for each rat. HbO: oxyhemoglobin, HbR: deoxyhemoglobin, SPz: spike peak occurrence time.
References
Osharina V, Aarabi A, Manoochehri M, Mahmoudzadeh M, Wallois F. Hemodynamic Changes Associated with Interictal Spikes Induced by Acute Models of Focal Epilepsy in Rats: A Simultaneous Electrocorticography and Near-Infrared Spectroscopy Study. Brain topography. 2017.
Osharina V, Ponchel E, Aarabi A, Grebe R, Wallois F. Local haemodynamic changes preceding interictal spikes: a simultaneous electrocorticography (ECoG) and near-infrared spectroscopy (NIRS) analysis in rats. Neuroimage 50, 600-607, 2010.