Cortical source imaging of resting-state EEG in children with benign epilepsy
Benign childhood epilepsy (BCE) is one of the most common idiopathic epilepsy with prevalence rates between 10 to 20% in children with epilepsy. Unlike other types of epilepsy, benign epilepsy is known to be unaffected by brain structural abnormalities. In this study, we investigated differences in resting-state EEG between BCE patients and healthy controls. For this purpose, we explored differences in EEG spectral power and cortical source densities between eleven BCE patients (with right centrotemporal spikes, Fig. 1) and twelve controls using high-density scalp EEG data in five frequency bands: δ (0.5–3.5 Hz), θ (4–8 Hz), α (8.5–13 Hz), β1 (13.5–20 Hz) and β2 (20.5–30 Hz). High density resting EEG data were recorded from each subject under the eyes closed condition. The artifact-free EEG data were segmented into two-second non-overlapping epochs. Two conditions were considered for epileptic patients, EEG segments with and without IEDs. Absolute and relative EEG spectral power were computed under these conditions in five different frequency bands (δ, θ, α, β1 and β2) in the sensor space. Patients and controls were then statistically compared with nonparametric statistical tests.
We further performed EEG cortical source analysis by using eLORETA (exact Low-Resolution Electromagnetic Tomography) to model 3D distributions of EEG cortical sources within different frequency bands. The eLORETA solution space was restricted to the cortical gray matter of the Adult MNI-ICBM152 head mode. Statistical comparisons of cortical sources between the two groups were performed in all five frequency bands using the statistical nonparametric mapping approach (SnPM) via randomization (Nichols and Holmes, 2002).
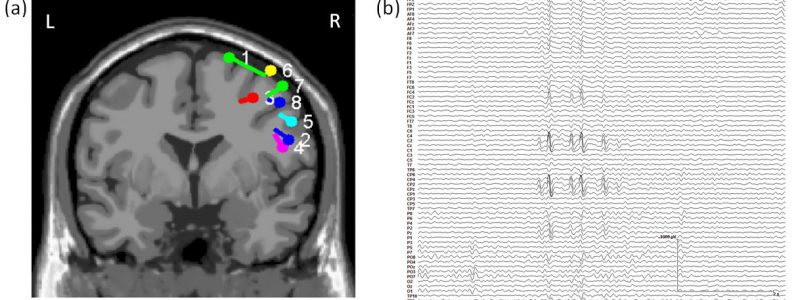
Figure 1. (a) Dipole locations of the averaged spikes for patients, and (b) a sample EEG recording from patient 1.
Our results showed that EEG resting-state functional networks in BCE patients were functionally disrupted regardless of the presence of spikes in EEG segments. In the sensor space, we found significant increases in relative and absolute θ power in all brain regions especially in the epileptogenic zone (right centrotemporal region) in comparison with healthy controls. The θ power decreased in the frontal and occipital regions in comparison with the central region in epileptic patients (Fig. 2). In the source space, significant increases in θ, α, and β cortical sources were observed in the right centrotemporal area under the with-spike condition (Figs 3 and 4). Under both with/without spike conditions, similar trends of spectral changes were observed in BCE patients in almost all frequency bands. This finding may reflect the modulatory effect of epileptic networks on the spectral power of cortical sources regardless of the presence of IED in EEG (Adebimpe et al., 2015).
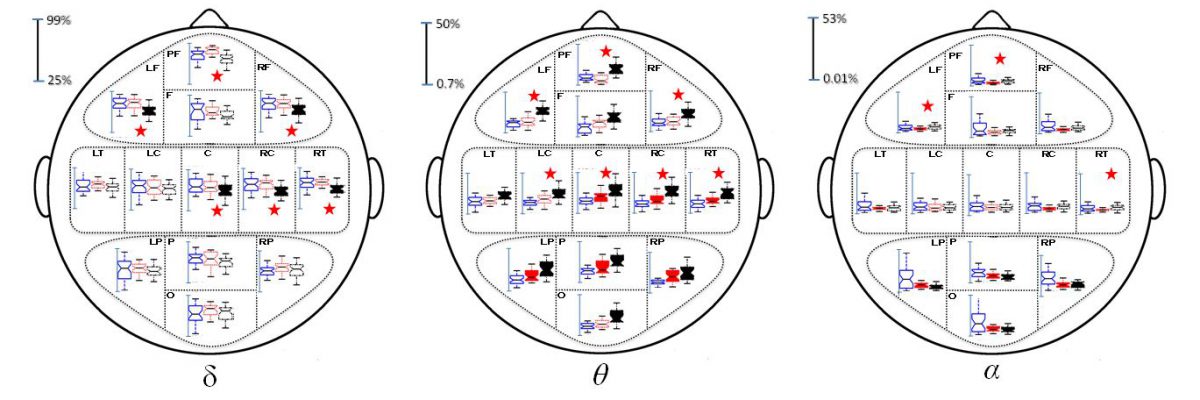
Figure 2. Average normalized spectral power maps (± standard deviation) in the sensor space under the eyes-closed condition for the control group (left boxplots), patient group (no spike condition, middle boxplots) and patient group (with spike condition, right boxplots) in the δ, θ and α bands. Significant differences between controls and patients (with/without spike conditions) are shown in solid boxplots. Asterisks indicate statistically significant differences (p<0.01) between conditions.
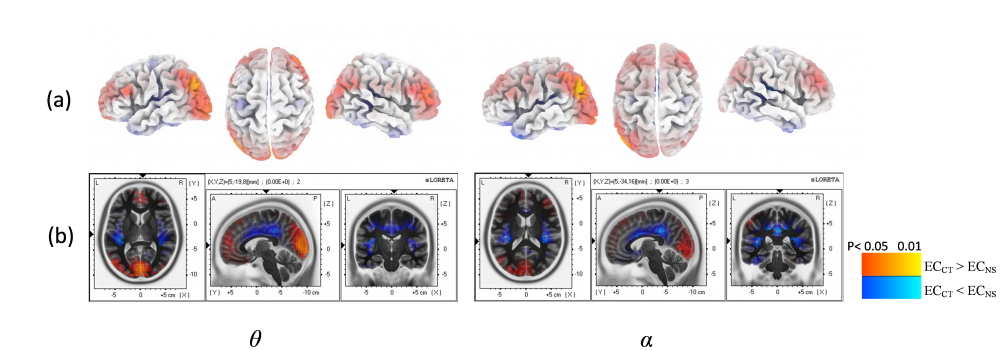
Figure 3. Statistical maps of differences between cortical sources computed under the eyes-closed condition for the control group (ECCT, left panel) and the patient group (ECNS, no spike condition, right panel) in θ and α bands. The results have been projected onto the cortical layer of the realistic head model (a) and the MNI152 MRI (b). Color bars indicate significant differences between ECCT and ECNS, red (ECCT > ECNS) and blue (ECCT < ECNS).
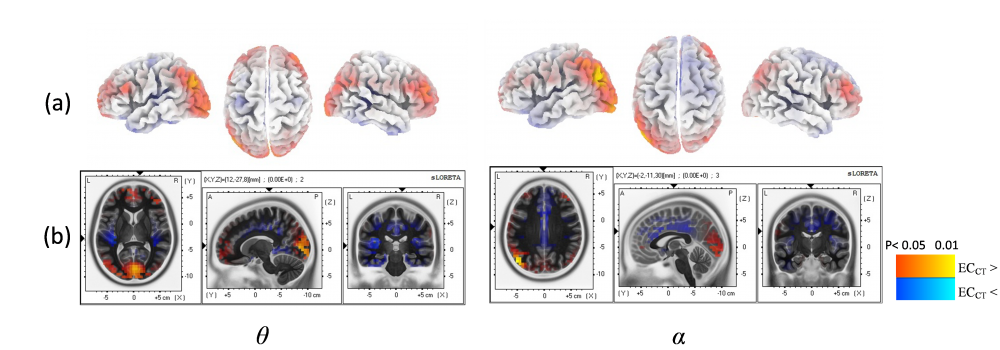
Figure 4. Statistical maps of differences between cortical sources computed under the eyes-closed condition for the control group (ECCT, left panel) and patient group (ECWS, with spike condition, right panel) in θ and α bands. The results have been projected onto the cortical layer of the realistic head model (a) and the MNI152 MRI (b). Color bars indicate significant differences between ECCT and ECWS, red (ECCT > ECWS) and blue (ECCT < ECWS).
Our overall findings indicate that, in addition to the dysfunction of the right centrotemporal region (the epileptic focus), cortical depression of frontal and occipital regions may show resting network disruption in benign childhood epilepsy.
Referencres
Adebimpe, A., Aarabi, A., Bourel-Ponchel, E., Mahmoudzadeh, M., Wallois, F., 2015. EEG resting state analysis of cortical sources in patients with benign epilepsy with centrotemporal spikes. NeuroImage Clinical. 2015;9:275-8.