Effect of data length on the reliability of resting-state fNIRS connectivity metrics
FNIRS, a non-invasive optical imaging technique, uses near-infrared light to measure variations in concentrations of oxyhemoglobin (HbO) and deoxyhemoglobin (HbR) in the brain. Functional connectivity analysis of resting state fNIRS (rs-fNIRS) signals has provided promising results for identification of resting state brain networks. Graph theoretical approaches have proven to be very useful for characterizing the functional structure of brain complex networks using resting state fNIRS/fMRI data. For graph theoretical analysis of brain networks, one requires to represent whole brain networks as a graph of nodes (brain regions) and edges (interactions between brain regions), defined based on functional associations between brain entities. Among the factors influencing the functional structure of brain functional networks derived from rs-fMRI data, different correlation metrics and scan length have shown to largely affect topological properties of brain networks and their reliability (Smith et al., 2011; Whitlow et al., 2011; Liang et al., 2012; Birn et al., 2013; Liao et al., 2013; Cao et al., 2014). In fNIRS connectivity analysis, it is still not well understood how the methodological choices including the selection of connectivity metrics and data length can affect the topological properties of rs-fNIRS-based functional connectivity patterns.
In this study, we performed a comprehensive assessment of the effect of data length on the reliability and stability of four functional connectivity measures using rs-fNIRS data. We further investigated the intersession reliability of twelve global and nodal graph measures commonly used for characterizing functional integration and segregation of information of brain networks with different data lengths.
The resting state fNIRS data collected from 13 healthy adult subjects (35 ± 12 years old) were included in this study. From each subject, 300-sec rs-fNIRS data have been collected in two separate sessions. All measurements have been collected with a continuous-wave near-infrared optical system (CW5, TechEn Inc., Milford, MA) using 32 laser diodes at 2 wavelengths (690 and 830 nm), 32 avalanche photodiodes (APD) and a sampling rate of 10 Hz (Mesquita et al., 2010). Fifty NIRS channels (source-detector pairs with a spatial separation of 3 cm) were positioned on the head, covering up frontal, parietal, temporal and occipital lobes (Fig. 1).
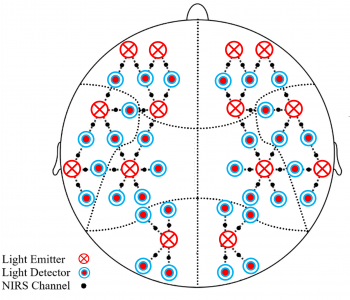
Figure 1. Whole-head optical probe used for data collection. Small bold dots show the position of the fNIRS channels used in this study.
The modified Beer-Lambert law was used to calculate the concentration change of HbR and HbO based on the differences in the absorption for the two wavelengths. The time courses of HbO, HbR and HbT signals were off-line band-pass filtered between 0.01 and 0.1 Hz using a second-order Butterworth filter to remove baseline drift and systemic physiological noise including respiration and cardiac activity.
To study the effect of data length on the reliability of functional connectivity measures and graph metrics, the concentration signals were segmented into overlapping epochs with lengths of 30, 60, 90 (short range), 120, 150, 180 (medium range), 210, 240 and 270 (long range) with an increment of 1 sec. To capture the overall changes in FC patterns, for each data length, 50 epochs were randomly selected. We used the rs-fNIRS data to examine the reliability of four FC measures across two sessions using the test-retest reliability (TRT) analysis. To construct a connectivity matrix for each data length, we used four connectivity measures including Pearson’s correlation (PC), percentage-bend correlation (BC), mutual information (MI) and partial correlation (PtC). For each data length and epoch, four weighted 50 × 50 connectivity matrices were generated by computing each of the connectivity measures between the fNIRS channels. We computed the absolute correlation values in each weighted matrix to only consider synchronization measures scaling from unsynchonized (zero value) to synchronized (with positive/negative values). For each subject, session and FC measure, the connectivity matrices were then averaged over the fifty epochs randomly selected for each data length to create an average connectivity matrix per data length.
We further investigated the reliability of twelve global network metrics, degree, characteristic path length, global efficiency, clustering coefficient, graph radius and diameter, transitivity, betweenness, modularity, participation coefficient, vulnerability and hierarchy largely used to characterize functional integration and segregation of brain networks (Sporns et al., 2004; Rubinov and Sporns, 2010). We also explored the reliability of the local properties of the constructed functional brain networks with degree, shortest path length, local efficiency, clustering coefficient, betweenness and vulnerability at nodal level (Watts and Strogatz 1998; Rubinov and Sporns 2010).
Since thresholding might significantly affect the topological properties of brain functional networks (De Vico Fallani et al., 2014; Garrison et al., 2015; Hahn et al., 2016), we performed the weighted functional connectivity analysis by computing the graph theoretical measures directly from the average weighted connectivity matrices. In weighted graphs, edges are characterized with connection strengths and the entire connectivity matrix is used to compute weighted graph metrics rather than sparse binary adjacency matrices (Rubinov and Sporns, 2010).
Non-parametric Friedman tests (with p<0.05) with multiple comparison were used to identify stability zones, within which the FC measures and graph metrics show stabilization with increasing/decreasing data lengths (Fraschini et al., 2016). We also assessed the statistical differences between the correlation values and graph metrics derived by each of the four connectivity measures using repeated measures analysis of variance (ANOVA, with p<0.05). Post-hoc paired t-tests were also used to characterize differences between the FC measures (with p<0.05). We further computed the Intraclass Correlation Coefficient (ICC) to assess the test-retest reliability of the FC measures and graph metrics by comparing the variability of these measures across the two sessions of the same subject to the total variation across sessions and subjects for each of the three concentration signals (HbO, HbR and HbT).
The stability analysis showed that the mean values of PC and BC stabilized with data lengths longer than 1-2.5 min depending on concentration signals (Fig. 2). Compared to PC and BC, the stabilization for MI occurred with medium to long-range data lengths (longer than 2.5 min). The partial correlation showed stability only for short to medium-range data lengths (2.5 min or less) for HbO and HbR. For HbT, however, its stability occurred with data lengths between 1.5-2.5 min.
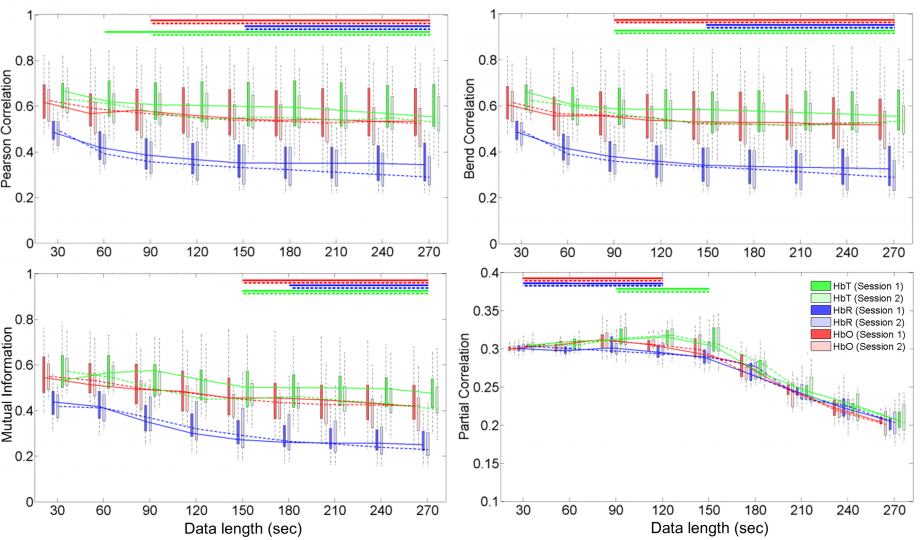
Figure 2. Boxplots showing median, interquartile range (shaded box), and 95% confidence ranges (whiskers) of absolute values for each FC measure computed over all channels and subjects for each session and concentration signal. The solid and dotted horizontal lines indicate the stability intervals within which no significant differences (p>0.05) in connectivity values were found between different data lengths for session 1 and 2, respectively.
Fig. 3 shows the results of the TRT analysis performed on each FC measure for HbO, HbR and HbT. For each data length, boxplots show average ICC values across all channels and subjects. High reliability was found for PC and BC with mean ICC values greater than 0.8 for all data lengths and concentration signals. The repeated-measures ANOVA showed no significant differences (p>0.05) between PC and BC for all data lengths. For HbO, the reliability decreased slightly for data lengths longer than 120 sec. MI also showed high reliability (mean ICC greater than 0.75) for all data lengths, exhibiting more variability for HbO and HbT compared to HbR. The reliability of MI significantly decreased for HbO and HbT for data lengths longer than 120 sec. The reliability of MI for HbR was found to be high (mean ICC greater than 0.8) with no significant variation across data lengths longer than 60 sec. Compared to the other FC measures, PtC yielded the lowest reliability (mean ICC values between 0.6 and 0.8) for data lengths shorter than 150 sec. The reliability of PtC decreased significantly with medium to long-range data lengths with higher variations across subjects and channels.
Our results showed that the majority of the global and regional (nodal) graph metrics derived by PC, BC and MI stabilized with increasing data length. The PC and BC-derived graph measures showed stability with short to medium-range data lengths longer than 1, 2.5 and 1.5 min for HbO, HbR and HbT, respectively. The MI-derived graph metrics required medium to long-range data length (longer than 2.5 min) to stabilize. The stability analysis on the network metrics derived by PtC revealed stability for short-range data lengths shorter than 1 min for HbO and HbR, and 2.5 min for HbT. Among all the metrics, the participation coefficient was found to be highly variable across sessions and subjects.
Fig. 4 shows the ICC maps for degree and shortest pathlength computed using each of the four FC measures as a function of data length for HbO. Overall, the ICC maps showed higher stability with increasing data lengths at the nodal level for the metrics computed by PC, BC and MI. The ICC maps of the metrics derived by BC and MI compared to PC were spatially more uniform across brain regions. In contrast, the reliability of the PtC-derived metrics was found to be only higher for data lengths shorter than 120 sec.
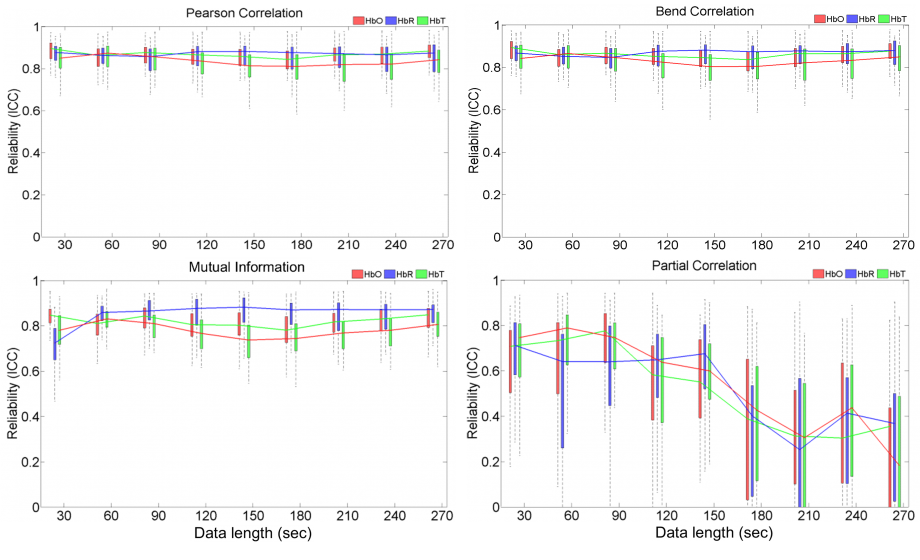
Figure 3. Boxplots of intraclass correlation (ICC) values as a function of data length. Boxplots show median, interquartile range (shaded box), and 95% confidence limits (whiskers) computed over all subjects for HbO, HbR, and HbT.
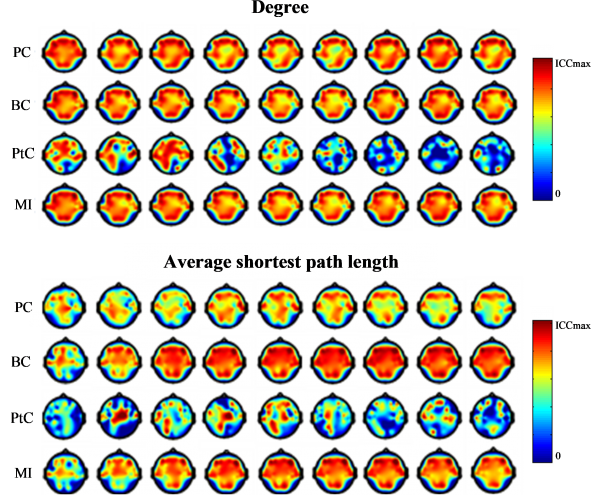
Figure 4. Intraclass correlation (ICC) maps for the nodal degree and shortest path length as a function of data length for HbO.
Our results suggest that caution should be taken when comparing results from studies on functional organization of brain networks when the FC analysis is performed with different data lengths, especially with short-range epoch lengths. Moreover, various graph metrics should be investigated and interpreted cautiously as they showed different sensitivities to data length.
Reference
Aarabi, A., Huppert, T.J., 2019. Assessment of the effect of data length on the reliability of resting-state fNIRS connectivity measures and graph metrics, Biomedical Signal Processing and Control 54, 101612.